Reproducing the figure in Python
Once retrieved, the stylized network data can be used
to reproduce the figure in Python. To this end you can use
the function netwulf.tools.draw_netwulf.
import networkx as nx
import netwulf as nw

G = nx.barabasi_albert_graph(100,1)

stylized_network, config = nw.visualize(G)

import matplotlib.pyplot as plt
fig, ax = nw.draw_netwulf(stylized_network)
plt.show()
A visualization window is opened and the network can be stylized. Once you’re done, press the button Post to Python. Afterwards, the figure will be redrawn in matplotlib and opened.
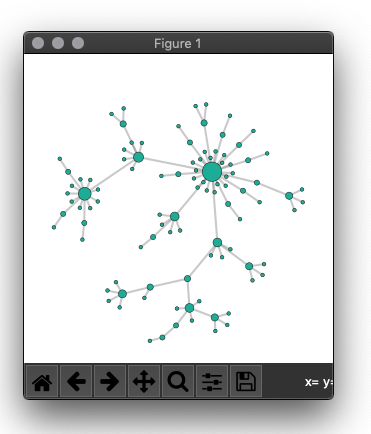
Reproduced figure
In order to add labels, use netwulf’s functions
netwulf.tools.add_edge_label
or
netwulf.tools.add_node_label.
add_edge_label(ax, stylized_network, (0,1))
add_node_label(ax, stylized_network, 9)
This will add the node id and edge tuple to the figure. You can add an optional label string as
add_edge_label(ax, stylized_network, (0,1), label='this edge')
add_node_label(ax, stylized_network, 9, label='this node')
For additional styling options check out the respective functions docstrings at
netwulf.tools.add_edge_label
or
netwulf.tools.add_node_label.