About this project
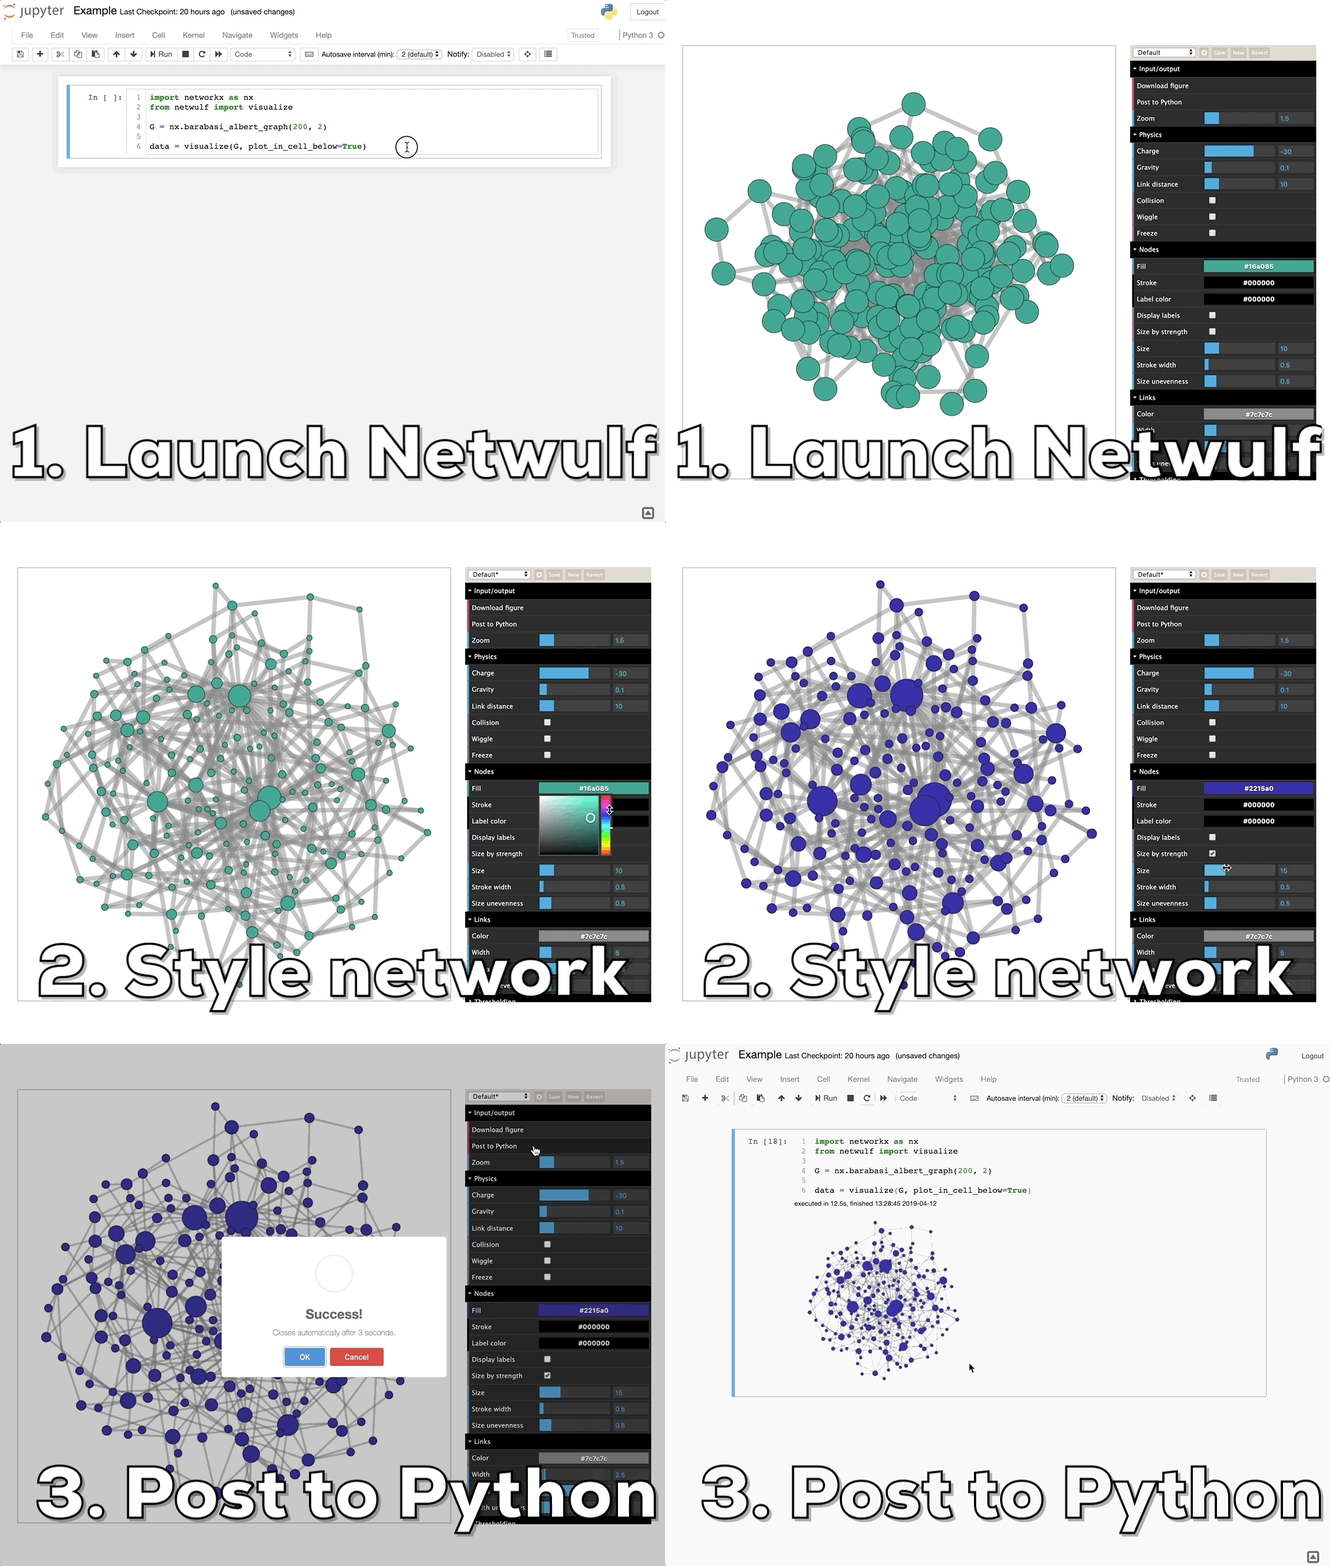
Netwulf is an interactive visualization tool for networkx Graph-objects, that allows you to produce beautifully looking network visualizations. Simply input a networkx.Graph object, style the network in the interactive console and either download the result as a PNG or pipe the layout back to Python for further processing. Netwulf is fast and relies on no crude dependencies. It is build around the philosophy that network manipulation and preprocessing should be done programmatically, but that the efficient generation of a visually appealing network is best done interactively, without code.
Quick example
import networkx as nx
from netwulf import visualize

G = nx.barabasi_albert_graph(100,2)

visualize(G)

started visualization
Why should I use netwulf
Pros
- Interactive styling of network visualizations in the browser, started from Python
- No compiling needed
- No external program needed
- Cross-platform
- Seamlessly use the inferred style back in Python
- Redraw the visualization in Python using matplotlib
Cons
- No multiedges yet
- No rendering of directed edges
Install
pip install netwulf
Make sure to read the README.md in the public repository for notes on dependencies and installation.
netwulf directly depends on the following packages which will be
installed by pip during the installation process
networkx>=2.0numpy>=0.14matplotlib>=3.0simplejson>=3.0
Bug reports & contributing
You can contribute to the public repository and raise issues there. Please also make sure to follow the code of conduct and to read the contributing notes.